Introduction Link to heading
As presented in other articles, I own a Mitsubishi Pajero which I have kept as a project car. Recently I noticed a worrying symptom: when driving above 3000 RPM under load, coolant would start appearing in the expansion tank, suggesting pressure was building up in the cooling circuit. The strange part was that the temperature gauge on the dashboard never showed any sign of overheating during these events.
This raised an immediate question: What is wrong with my cooling circuit? I immediately went for the 5 Whys technique.
- Coolant increased drastically in the expansion tank - Why?
- Because pressure increased in the radiator - Why?
- The radiator cap didn’t allow for coolant to go back to the radiator - Why?
- Because pressure was higher than what is usually expected in the cooling circuit - Why?
- Something is creating pressure in the cooling circuit - why?
Here started the mechanical investigation, where I started by:
➞ Changing the radiator cap: A bad radiator cap could lead to coolant not returning to the rad and it’s cheap to replace, this wasn’t the issue.
➞ Changing the radiator: My radiator was gunked up with rust smush, a blocked radiator could also lead to this behavior. I replaced it and kept having the same problem.
➞ Verify the water pump: If the water pump was bad or air-locked in some way, it could be cavitating or something and creating more pressure than expected, I inspected it and everything was fine.
While replacing the radiator I took the time to also replace the thermostat, the old one was fine but was all rusty as well. So, the only other thing creating pressure in the circuit was a blown head gasket, which was the most probable cause, but is still one of the most expensive repairs.
At this point I handed it to a mechanic, as this job is a bit too much for me and I prefer to have someone dedicated to it instead of me trying to do it.
Still, I was left wondering, I never actually saw the temperature rise above the normal operating temperature, how could it have broken the head gasket?
So I decided to do a deep dive on the temperature gauge circuit and figure out the hardware.
This post documents my investigation into the coolant temperature sensor and gauge circuit to try to understand the situation.
The Circuit Link to heading
The Pajero 4M40 uses two separate components for temperature measurement:
- A-104 – Engine coolant temperature gauge unit (the sender that drives the dashboard gauge needle)
- A-113 – Engine coolant temperature sensor (used by the ECU for fuel/ignition management)
These are physically different units, mounted in the engine block, and they serve different purposes. The wiring diagram for the engine compartment (page 49, section 2A-32) shows how both are wired:
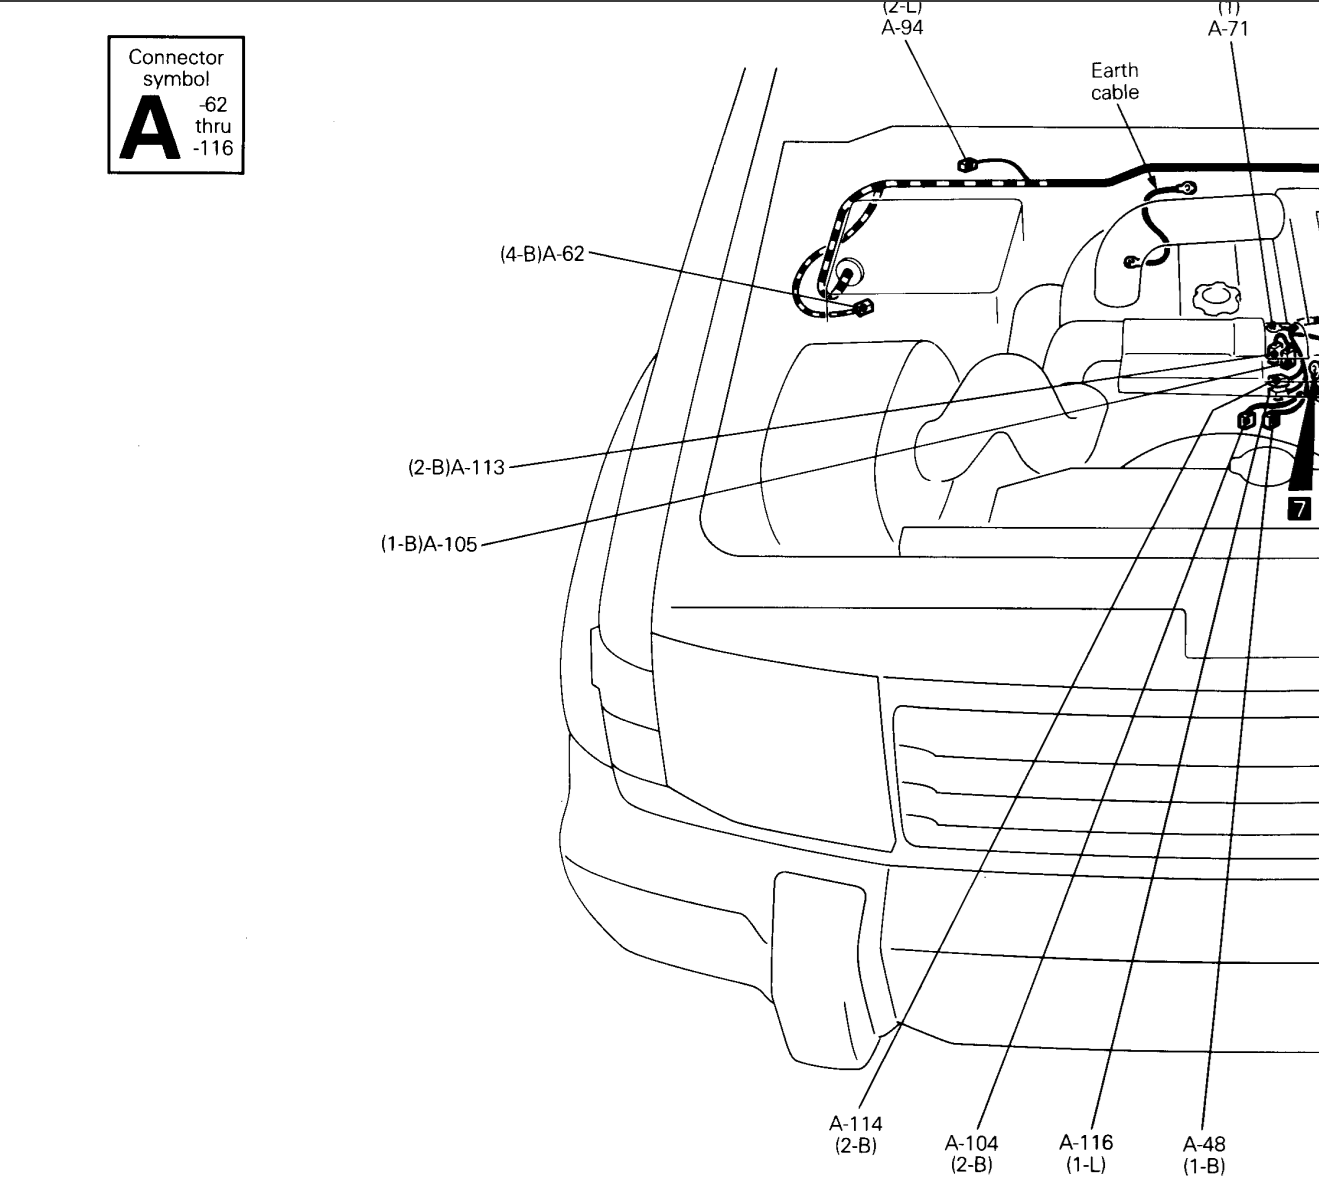
Engine compartment wiring - temp gauge unit and sensor
The location of both sensors in the engine can be seen below:
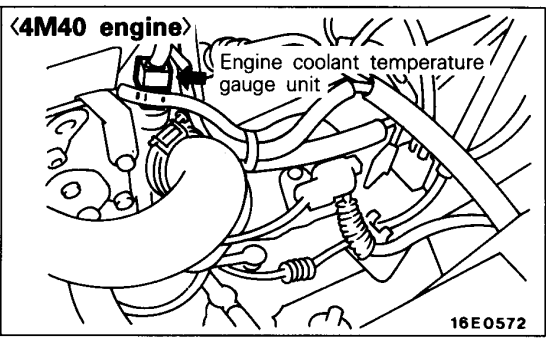
Coolant temperature sensor location on the 4M40
The troubleshooting guide for the meter and gauge circuit (section 4A-150, page 247) also provides useful diagnostic steps and the expected resistance values for the gauge sender:
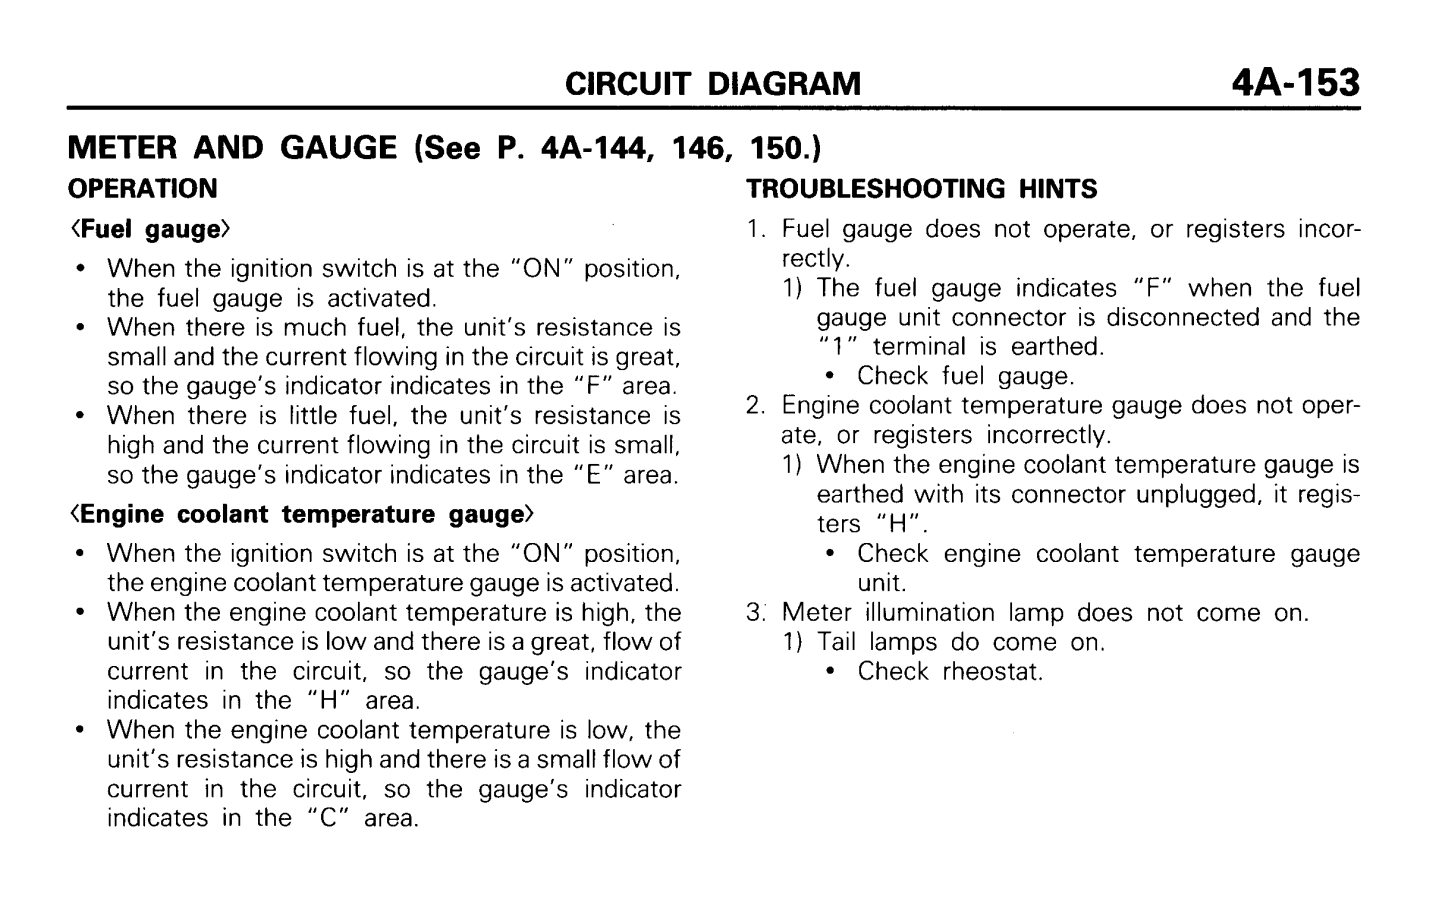
Troubleshoot notes from the 4M40 workshop manual
Hardware Investigation Link to heading
There are two major aspects to investigate in this system:
- The physical gauge loop: Checking the resistance values needed to command the various needle positions on the dashboard gauge.
- The actual physical sensor: Mapping out real-world resistance-to-temperature curves of the coolant sensor in a controlled bath.
1. Dashboard Gauge Needle Calibration Test Link to heading
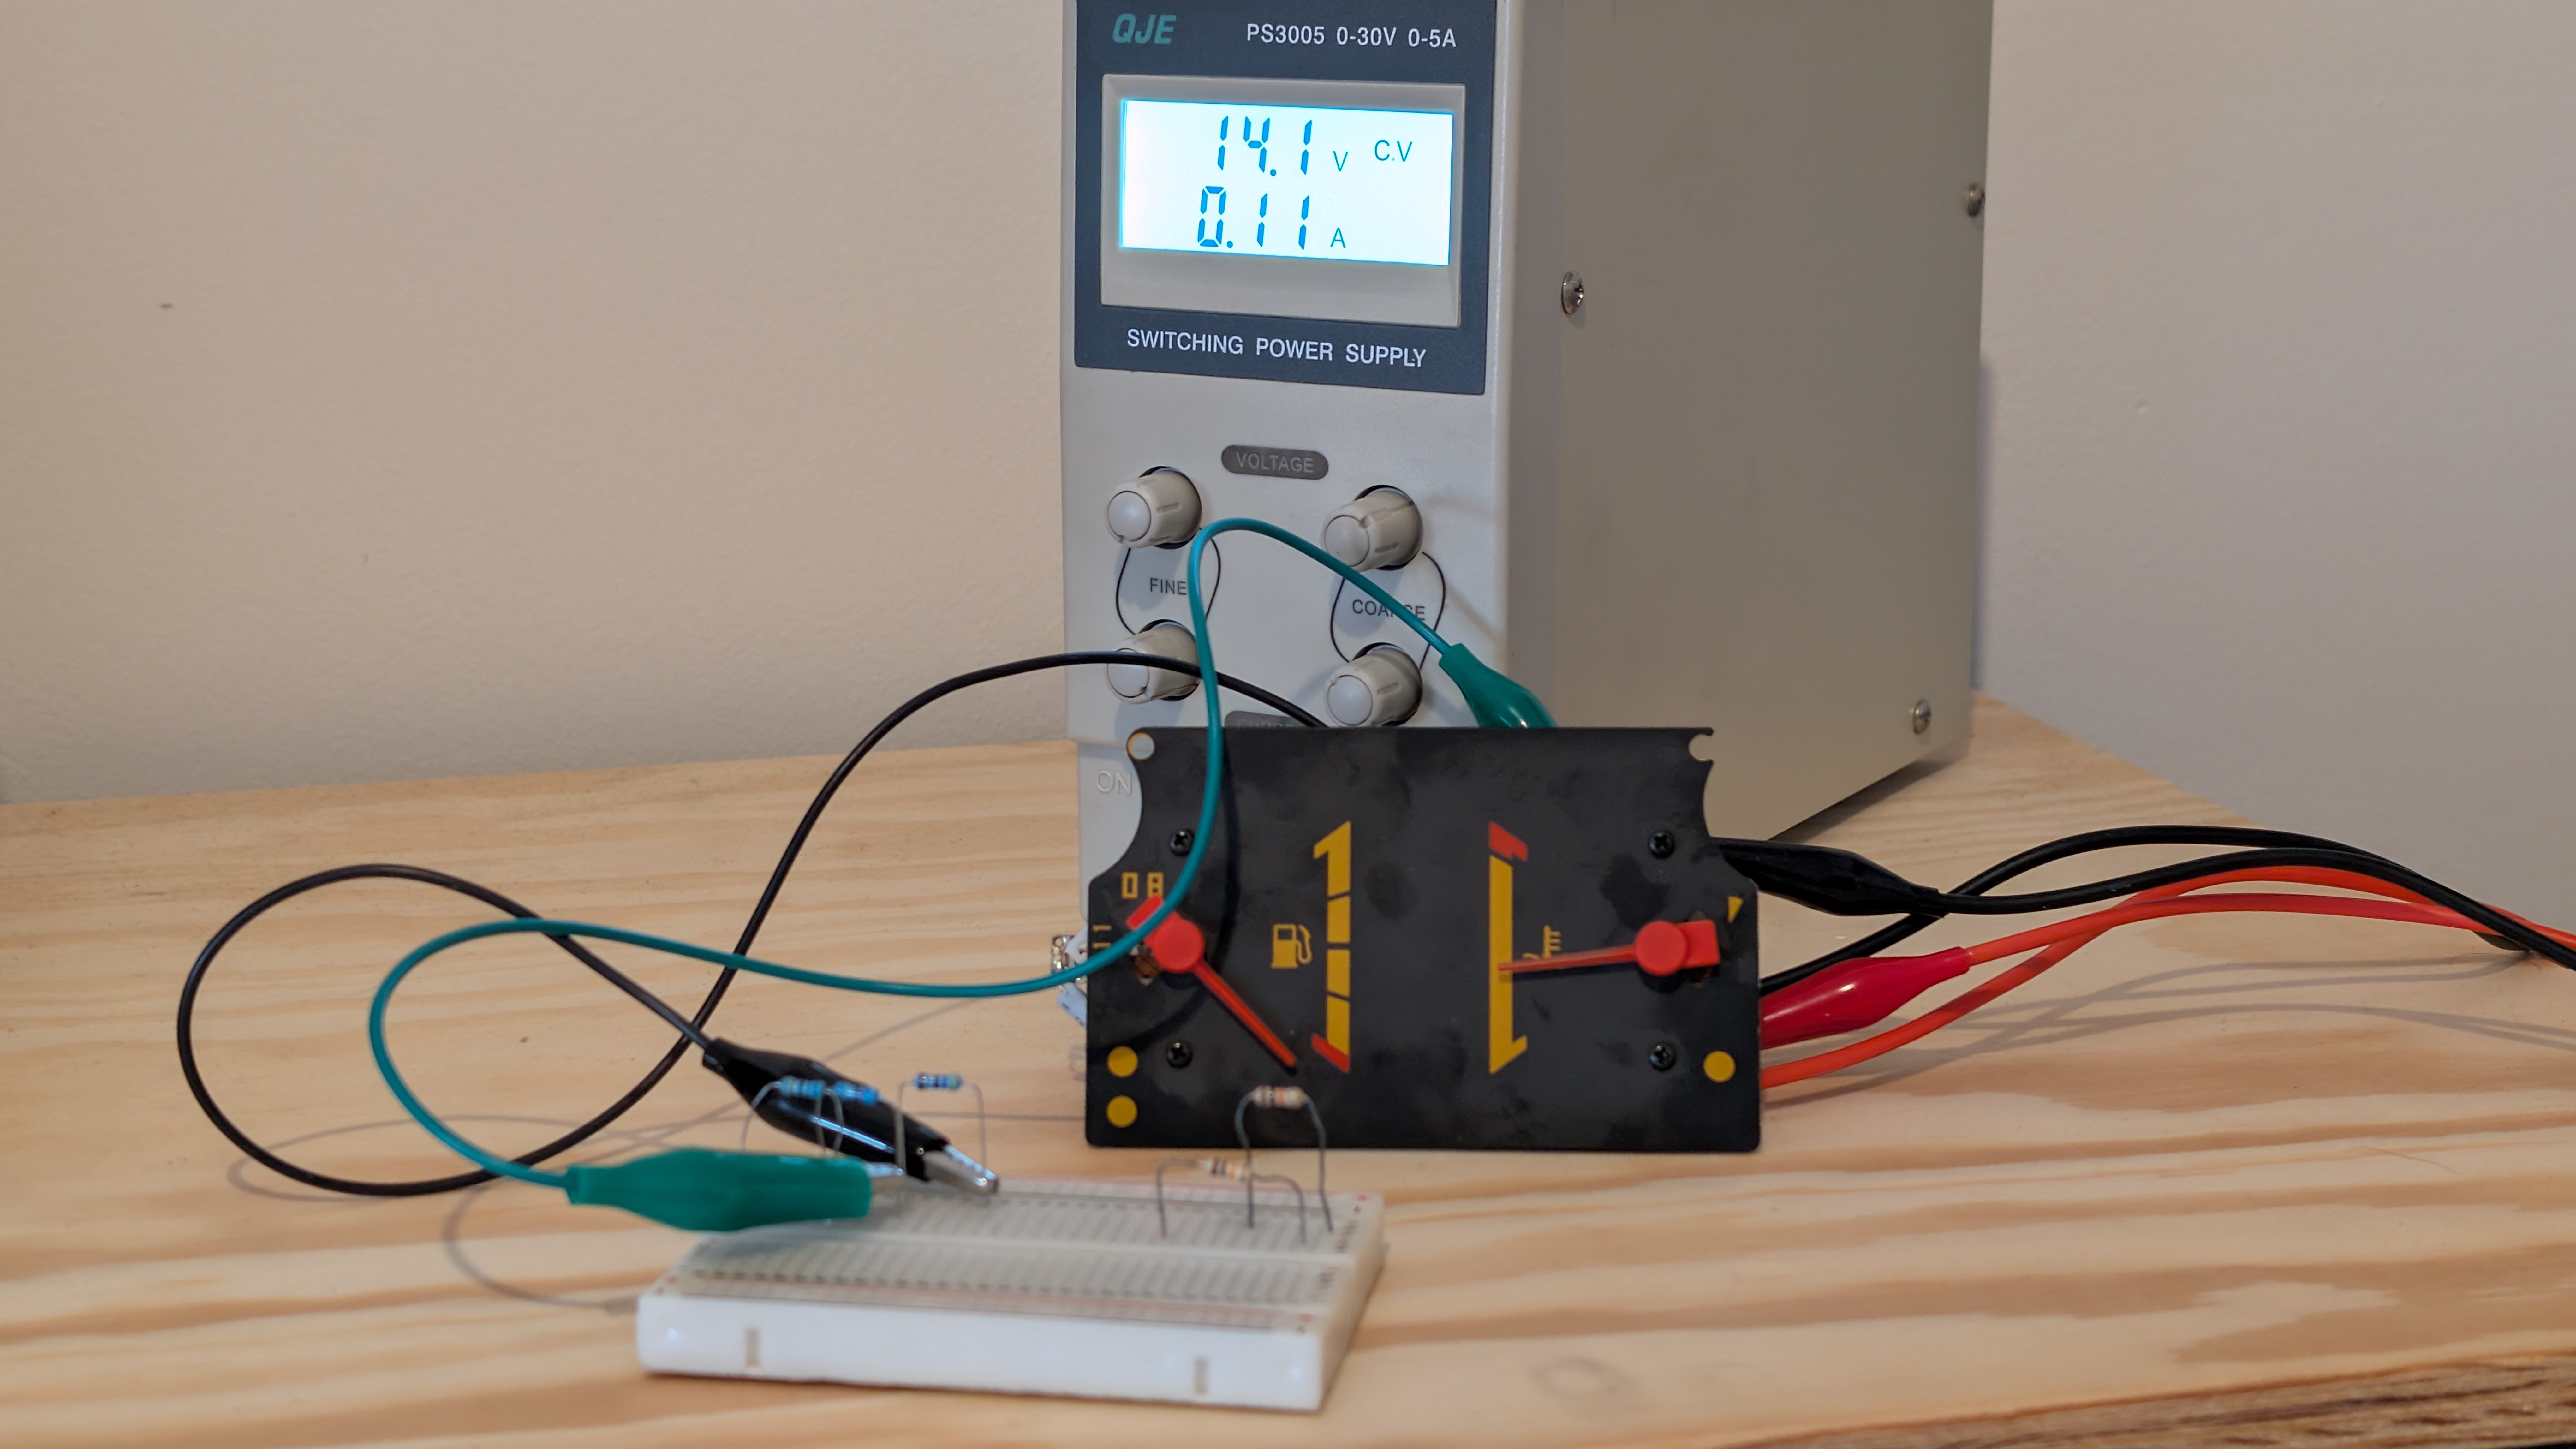
First, to understand what resistance values the dashboard’s bimetallic temperature gauge expected in order to display different states, I bypassed the engine block sensor and simulated engine temperatures using a series of fixed resistors to ground:
| Wire Resistance to Ground (Ω) | Needle Position / Dashboard Reading | Meaning of State |
|---|---|---|
| 47 Ω | Reaches “middle” (beginning of centered region) | Normal cold-to-warm transition |
| 32 Ω | Center of normal range (ideal operating position) | Normal warmed-up operating state |
| 20 Ω | Starts rising above the center range | Beginning of over-temp threshold |
47 Ω
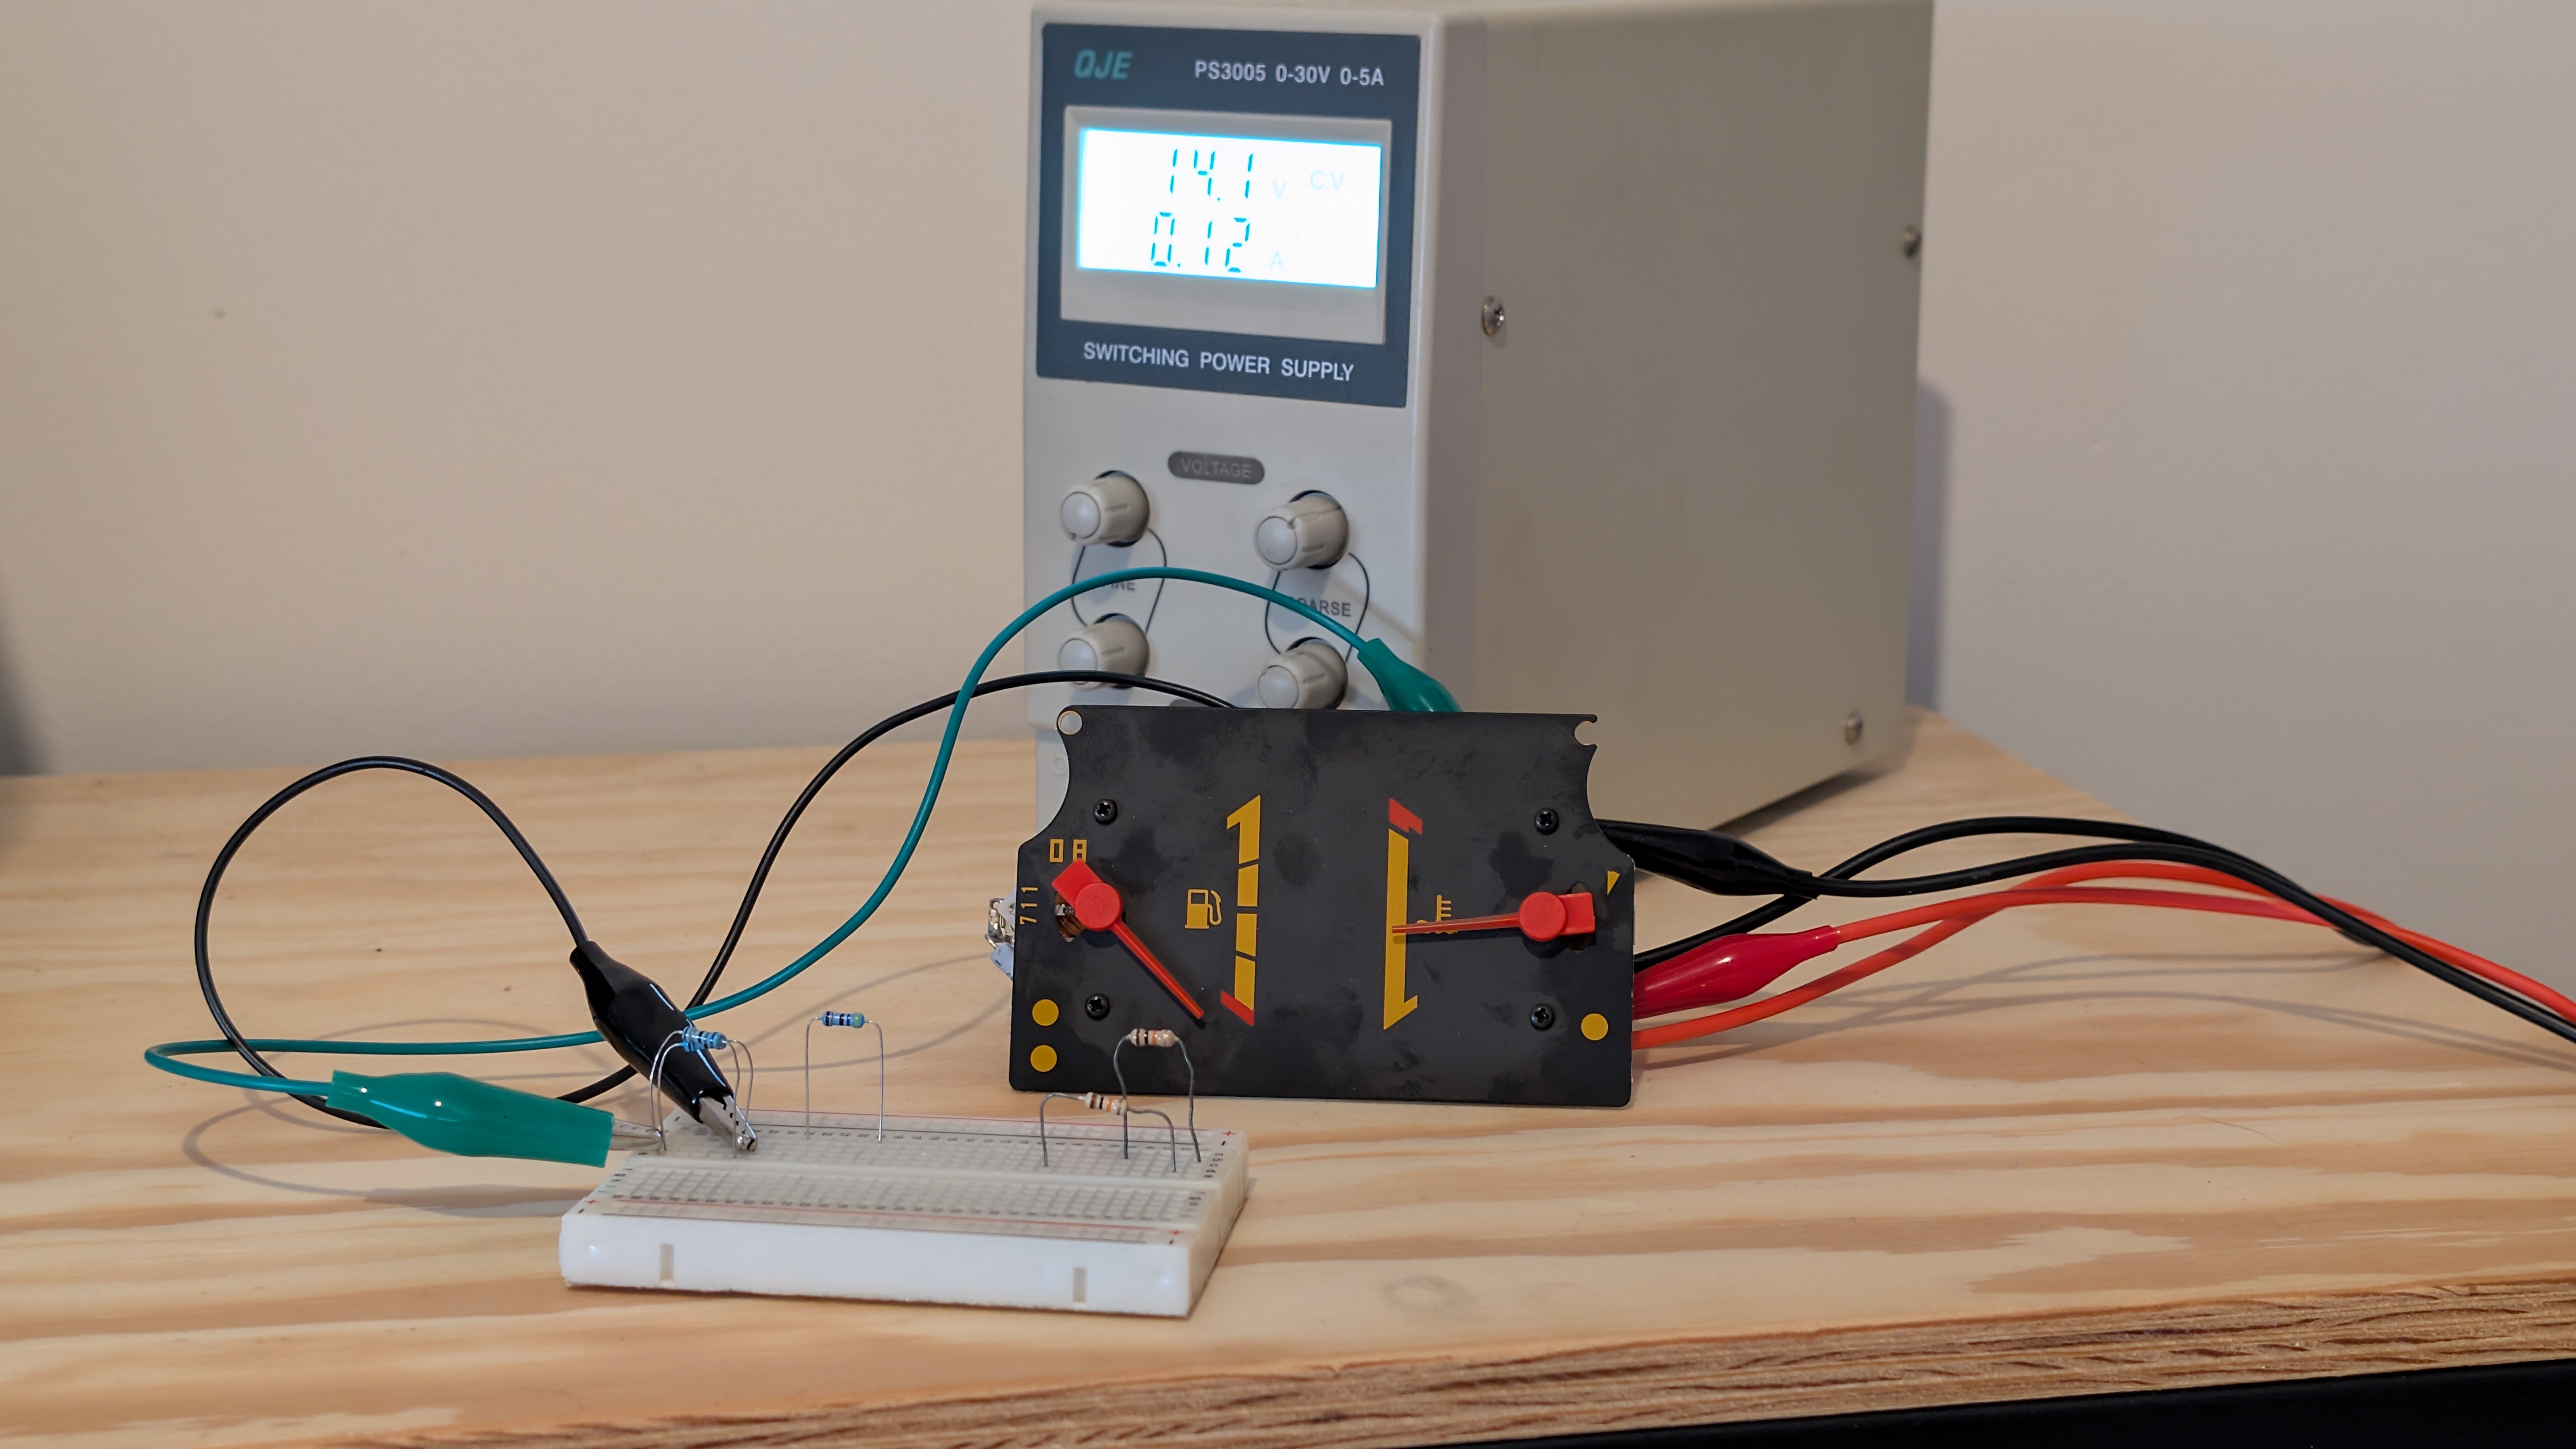
32 Ω
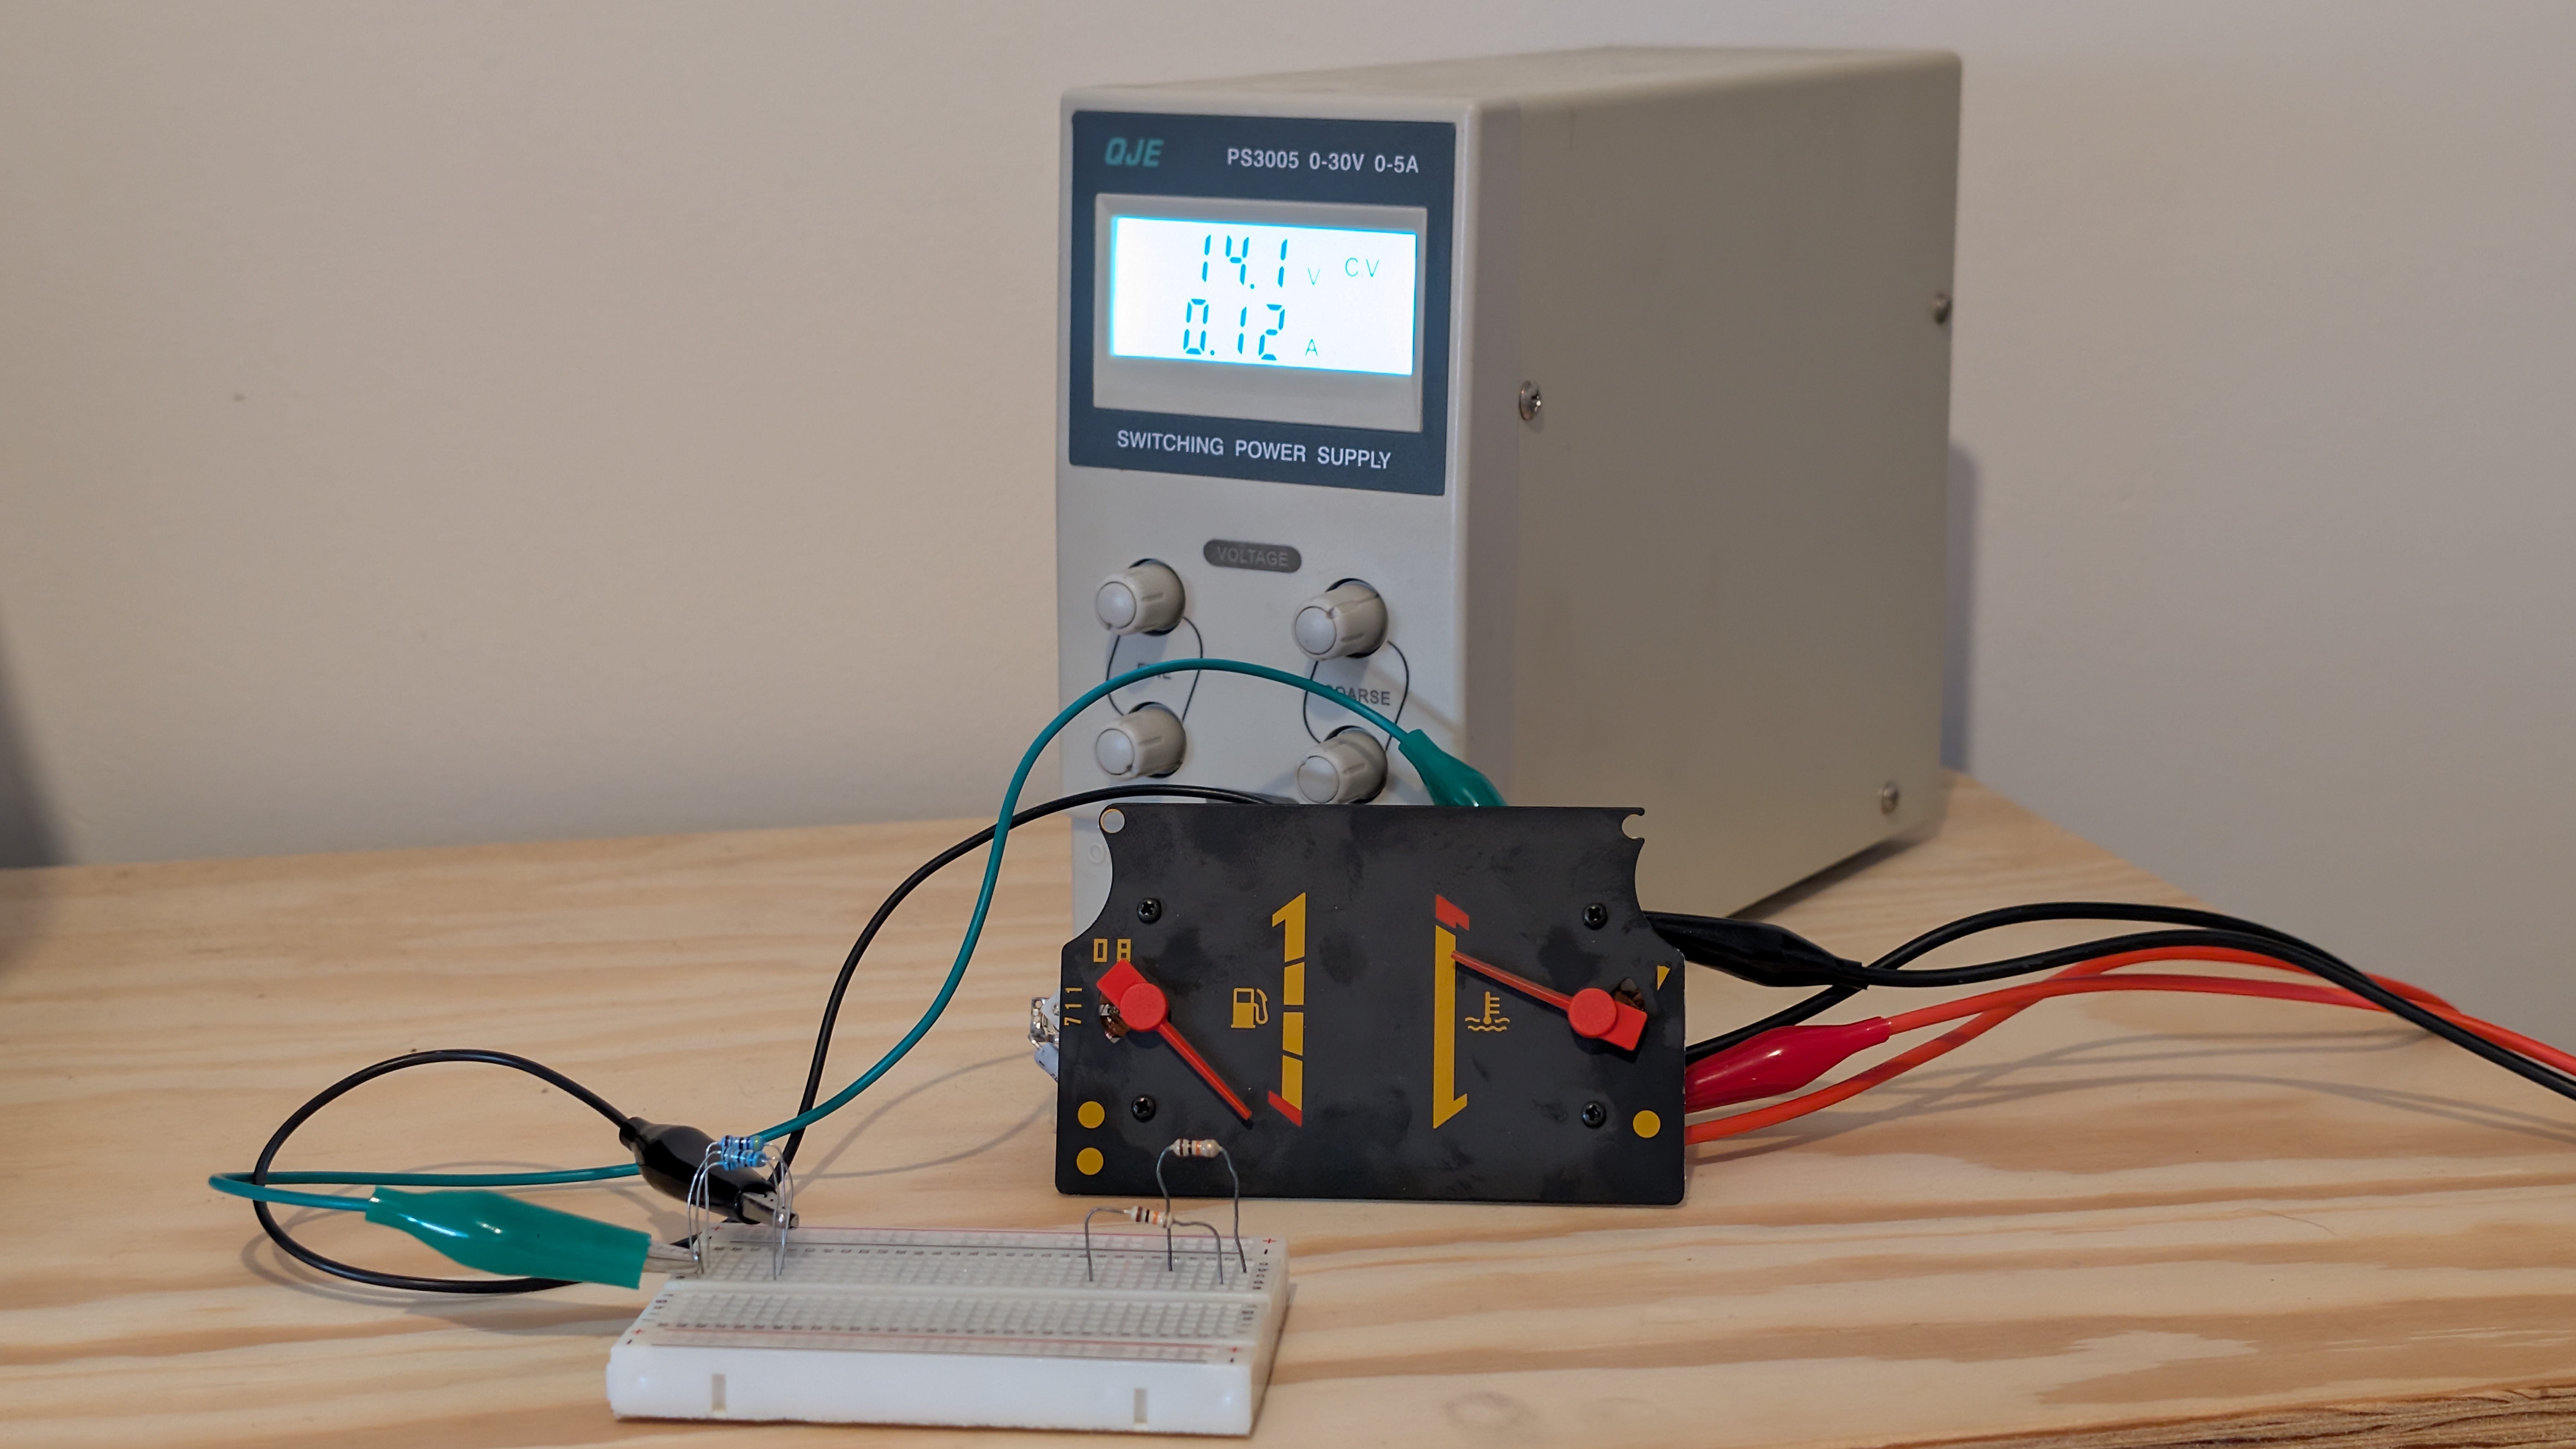
20 Ω
This test shows that the physical needle gauge expects roughly 47–67 Ω of resistance during normal fully-warmed operation, and anything below ~20 Ω should result in a rising needle pointing towards overheating.
2. Measuring the Actual Coolant Temperature Sensor Link to heading
With a gas stove, a thermometer and a multimeter, I mapped out the real-world performance of the actual temperature sensor at various temperature points:
| Temperature (°C) | Measured Resistance (Ω) |
|---|---|
| 31 °C | 1731 |
| 38 °C | 1695 |
| 57 °C | 615 |
| 72 °C | 418 |
| 75 °C | 366 |
| 80 °C | 320 |
Comparing the Curves: Gauge vs. Sensor Link to heading
There is a glaring discrepancy here:
- At a fully warmed up 80 °C, our actual sensor measures 320 Ω.
- But our dashboard instrument requires 47–67 Ω to reach the “middle” operating scale!
If we hooked this sensor directly to our gauge, the 320 Ω resistance would keep the needle pinned to the very bottom (completely cold), even with the engine running at a perfect 80 °C.
The Realization: I Got the Wrong Sensor! Link to heading
This is where the classic trap of auto parts sourcing comes in. The Mitsubishi Pajero uses a dual-component architecture for temperature measurement:
- A-104 (Gauge Sender Unit): A single-pin sensor grounding directly through the engine block. Because it has to drive high thermal induction currents through the dashboard bimetallic coil to deflect the heavy instrument needle, it uses a low-resistance curve (nominally ~100 Ω cold, ~50 Ω normal operating, ~20 Ω hot).
- A-113 (Engine Coolant Temp Sensor / ECT): A two-pin sensor connected directly to the Engine ECU. Since it only sends a signal to a high-impedance ADC reference in the engine computer, it uses a high-resistance curve (~2.5 kΩ cold, ~300 Ω at normal operating temps).
When sourcing a replacement part to solve my non-responsive dashboard temperature gauge, I accidentally ordered and measured the ECU Coolant Temp Sensor (A-113) instead of the Gauge Sender Unit (A-104)!
The measurements I performed in the thermal bath are absolutely perfect and fit a standard ECU thermistor curve flawlessly, but they are completely incompatible with the analog dashboard gauge loop. I was measuring the wrong sensor the entire time!
Fitting the NTC Curve for the (Wrong) ECU Sensor Link to heading
Let’s derive the Beta ($\beta$) value of this ECU sensor to document its curve anyway. Using our outer data points at 80 °C (353.15 K, 320 Ω) and 31 °C (304.15 K, 1731 Ω):
$$ \beta = \frac{\ln(1731 / 320)}{\dfrac{1}{304.15,\text{K}} - \dfrac{1}{353.15,\text{K}}} \approx 3701,\text{K} $$
Setting a typical optimized constant base of $\beta = 3550,\text{K}$, and using $R_0 = 320,\Omega$ at reference $T_0 = 353.15,\text{K}$ (80 °C), let’s see how our fitted curve aligns with the entire benchmark dataset:
| Temperature (°C) | Fitted Expected R (Ω) | Actual Measured R (Ω) | Accuracy / Match |
|---|---|---|---|
| 20 °C | ~2570 | — | (Typical cold start spec: ~2.5 kΩ) |
| 31 °C | 1616 | 1731 | ✓ +7% deviation |
| 38 °C | 1243 | 1695 | ⚠ +36% deviation (experimental margin) |
| 57 °C | 643 | 615 | ✓ -4% deviation |
| 72 °C | 404 | 418 | ✓ +3% deviation |
| 75 °C | 370 | 366 | ✓ -1% deviation |
| 80 °C | 320 | 320 | ✓ reference anchor |
The fitted model matches my experimental measurements with incredible precision, particularly at the active running ranges above 50 °C. This proves that the ECU sensor itself is in perfect health and follows a standard Mitsubishi NTC curve, even if it is completely mismatched for my dashboard gauge problem!
Conclusions from the Sensor Investigation Link to heading
- I measured and verified the wrong thermal sensor: The bench test curves match the high-resistance Engine ECU NTC sensor (A-113) specifications perfectly, but have absolutely nothing to do with driving the low-resistance dashboard gauge unit (A-104).
- The dashboard gauge tests remain valid: Sourcing fixed resistance values directly in the harness proves that the physical dashboard indicator loop requires a low resistance range of 20–67 Ω to deflect the needle.
- The mystery continues: Because I was testing the ECU sensor instead of the gauge sender, I still haven’t verified the status of the actual dashboard sender unit (A-104) inside the car.