Earlier Work Link to heading
To have an overview on this project, take a look at the project webpage
Target Link to heading
The idea with these displays is to explore what can be achieved using ImPlot available and to allow all signals to be visible. Also, we need to figure out a way store the run so its possible to review the data at a later instance.
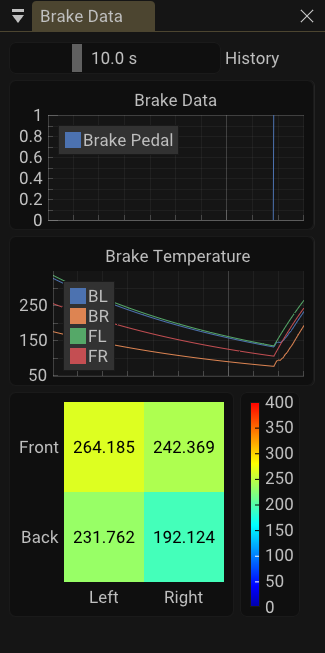
Brake live data Link to heading
The brake data widget shows only to performance indicators, the brake pedal position and the brake temperature for all four corners.
The temperature of the corners is shown in two different ways, first in a live graph with a variable history time, and second with a heat map picture.
The Temp v Time graphic is helpful to check what happened in the last few seconds while the heatmap allows the user to have a real time feeling of how the temperature is evolving in each corner of the vehicle.
Everything discussed inside this chapter can be found within the DataClientLayer::BrakeData()
Brake Signals
Circular buffer Link to heading
To only display the last few seconds, we need to have access to signal history and not only to the last value. This could be done by accessing the EASportsWRC storage vector. However, this would mean using some logic to always obtain the last vector value + the determined history (user defined). Also another issue is that for a stress free display, you need to create a ImVec2 vector.
The Example from ImPlot is really helpful for this specific case, there you can find a definition for a ScrollingBuffer
 1// utility structure for realtime plot
 2struct ScrollingBuffer {
 3	int MaxSize;
 4	int Offset;
 5	ImVector<ImVec2> Data;
 6	ScrollingBuffer(int max_size = 2000) {
 7		MaxSize = max_size;
 8		Offset = 0;
 9		Data.reserve(MaxSize);
10	}
11	void AddPoint(float x, float y) {
12		if (Data.size() < MaxSize)
13			Data.push_back(ImVec2(x, y));
14		else {
15			Data[Offset] = ImVec2(x, y);
16			Offset = (Offset + 1) % MaxSize;
17		}
18	}
19	void Erase() {
20		if (Data.size() > 0) {
21			Data.shrink(0);
22			Offset = 0;
23		}
24	}
25};
The ScrollingBuffer.Data contains a X and a Y field, where X is time and Y is the displayed data.
Using this structure allows for a stress free usage since it implements everything that we already needed, now adding
a new point is as simple as calling the .AddPoint() method.
1//Use always the lastest value from the stored vector
2current_time = l_EASportsWRC.TelemetryData_v.current_time.back();
3BrakePos.AddPoint(current_time, BrakePosition);
4BrakeTempbl.AddPoint(current_time, l_EASportsWRC.TelemetryData_v.brake_temp_bl.back());
5
6...
7
8ImPlot::PlotLine("BL", &BrakeTempbl.Data[0].x, &BrakeTempbl.Data[0].y, BrakeTempbl.Data.size(), 0, BrakeTempbl.Offset, 2 * sizeof(float));
Heatmap Link to heading
The heat map is very intuitive to use, it just needs the right matrix as input and it will take the right shape
 1	/********************************************************************************************/
 2	/*																							*/
 3	/*											Brake HeatMaps									*/
 4	/*																							*/
 5	/********************************************************************************************/
 6
 7	static const char* xlabels[] = { "Left","Right"};
 8	static const char* ylabels[] = { "Front","Back"};
 9	static float values[2][2] = { {0,0},
10								{0,0} };
11
12	if (l_EASportsWRC.GetOnStage() && l_EASportsWRC.TelemetryData_v.brake_temp_bl.size() != 0)// only need to check size of one
13	{
14		values[0][0] = l_EASportsWRC.TelemetryData_v.brake_temp_fl.back();
15		values[0][1] = l_EASportsWRC.TelemetryData_v.brake_temp_fr.back();
16		values[1][0] = l_EASportsWRC.TelemetryData_v.brake_temp_bl.back();
17		values[1][1] = l_EASportsWRC.TelemetryData_v.brake_temp_br.back();
18	}
19
20	static float scale_min = 0;
21	static float scale_max = 400;
22
23	static ImPlotColormap map = ImPlotColormap_Jet;
24	static ImPlotHeatmapFlags hm_flags = 0;
25	static ImPlotAxisFlags axes_flags = ImPlotAxisFlags_Lock | ImPlotAxisFlags_NoGridLines | ImPlotAxisFlags_NoTickMarks;
26	ImPlot::BustColorCache("##Heatmap1");
27	ImPlot::PushColormap(map);
28
29	if (ImPlot::BeginPlot("##Heatmap1", ImVec2(225, 225), ImPlotFlags_NoLegend | ImPlotFlags_NoMouseText)) {
30		//ImPlot::PushColormap(map);
31		ImPlot::SetupAxes(NULL, NULL, axes_flags, axes_flags);
32		ImPlot::SetupAxisTicks(ImAxis_X1, 0 + 1.0 / 4.0, 1 - 1.0 / 4.0,2,xlabels);
33		ImPlot::SetupAxisTicks(ImAxis_Y1, 1 - 1.0 / 4.0, 0 + 1.0 / 4.0,2, ylabels);
34		ImPlot::PlotHeatmap("heat", values[0],2, 2, scale_min, scale_max, "%g", ImPlotPoint(0, 0), ImPlotPoint(1, 1), hm_flags);
35		ImPlot::EndPlot();
36	}
37	ImGui::SameLine();
38	ImPlot::ColormapScale("##HeatScale", scale_min, scale_max, ImVec2(60, 225));
39	ImPlot::PopColormap();
If you like my projects please consider supporting my hobby by buying me a coffee☕ 😄